Remote Debugging Python in external environment. Example with Blender
- Published on
- • 2 mins read•--- views
Sometimes you need to debug Python code running in an external environment from your local IDE. In this tutorial, I’ll cover the situation where a Python script is executed in Blender. I need to set a breakpoint, inspect variable values, and step through the script. I’ll show two methods for VSCode and PyCharm.
PyCharm
This method is simpler and more automated—almost out of the box. First, you need to add a special run configuration, then install the pydevd-pycharm library. In the script that will be executed in Blender, add the following command to connect to the debug server. The screenshots below show everything, and the code you need to embed in your script is provided.
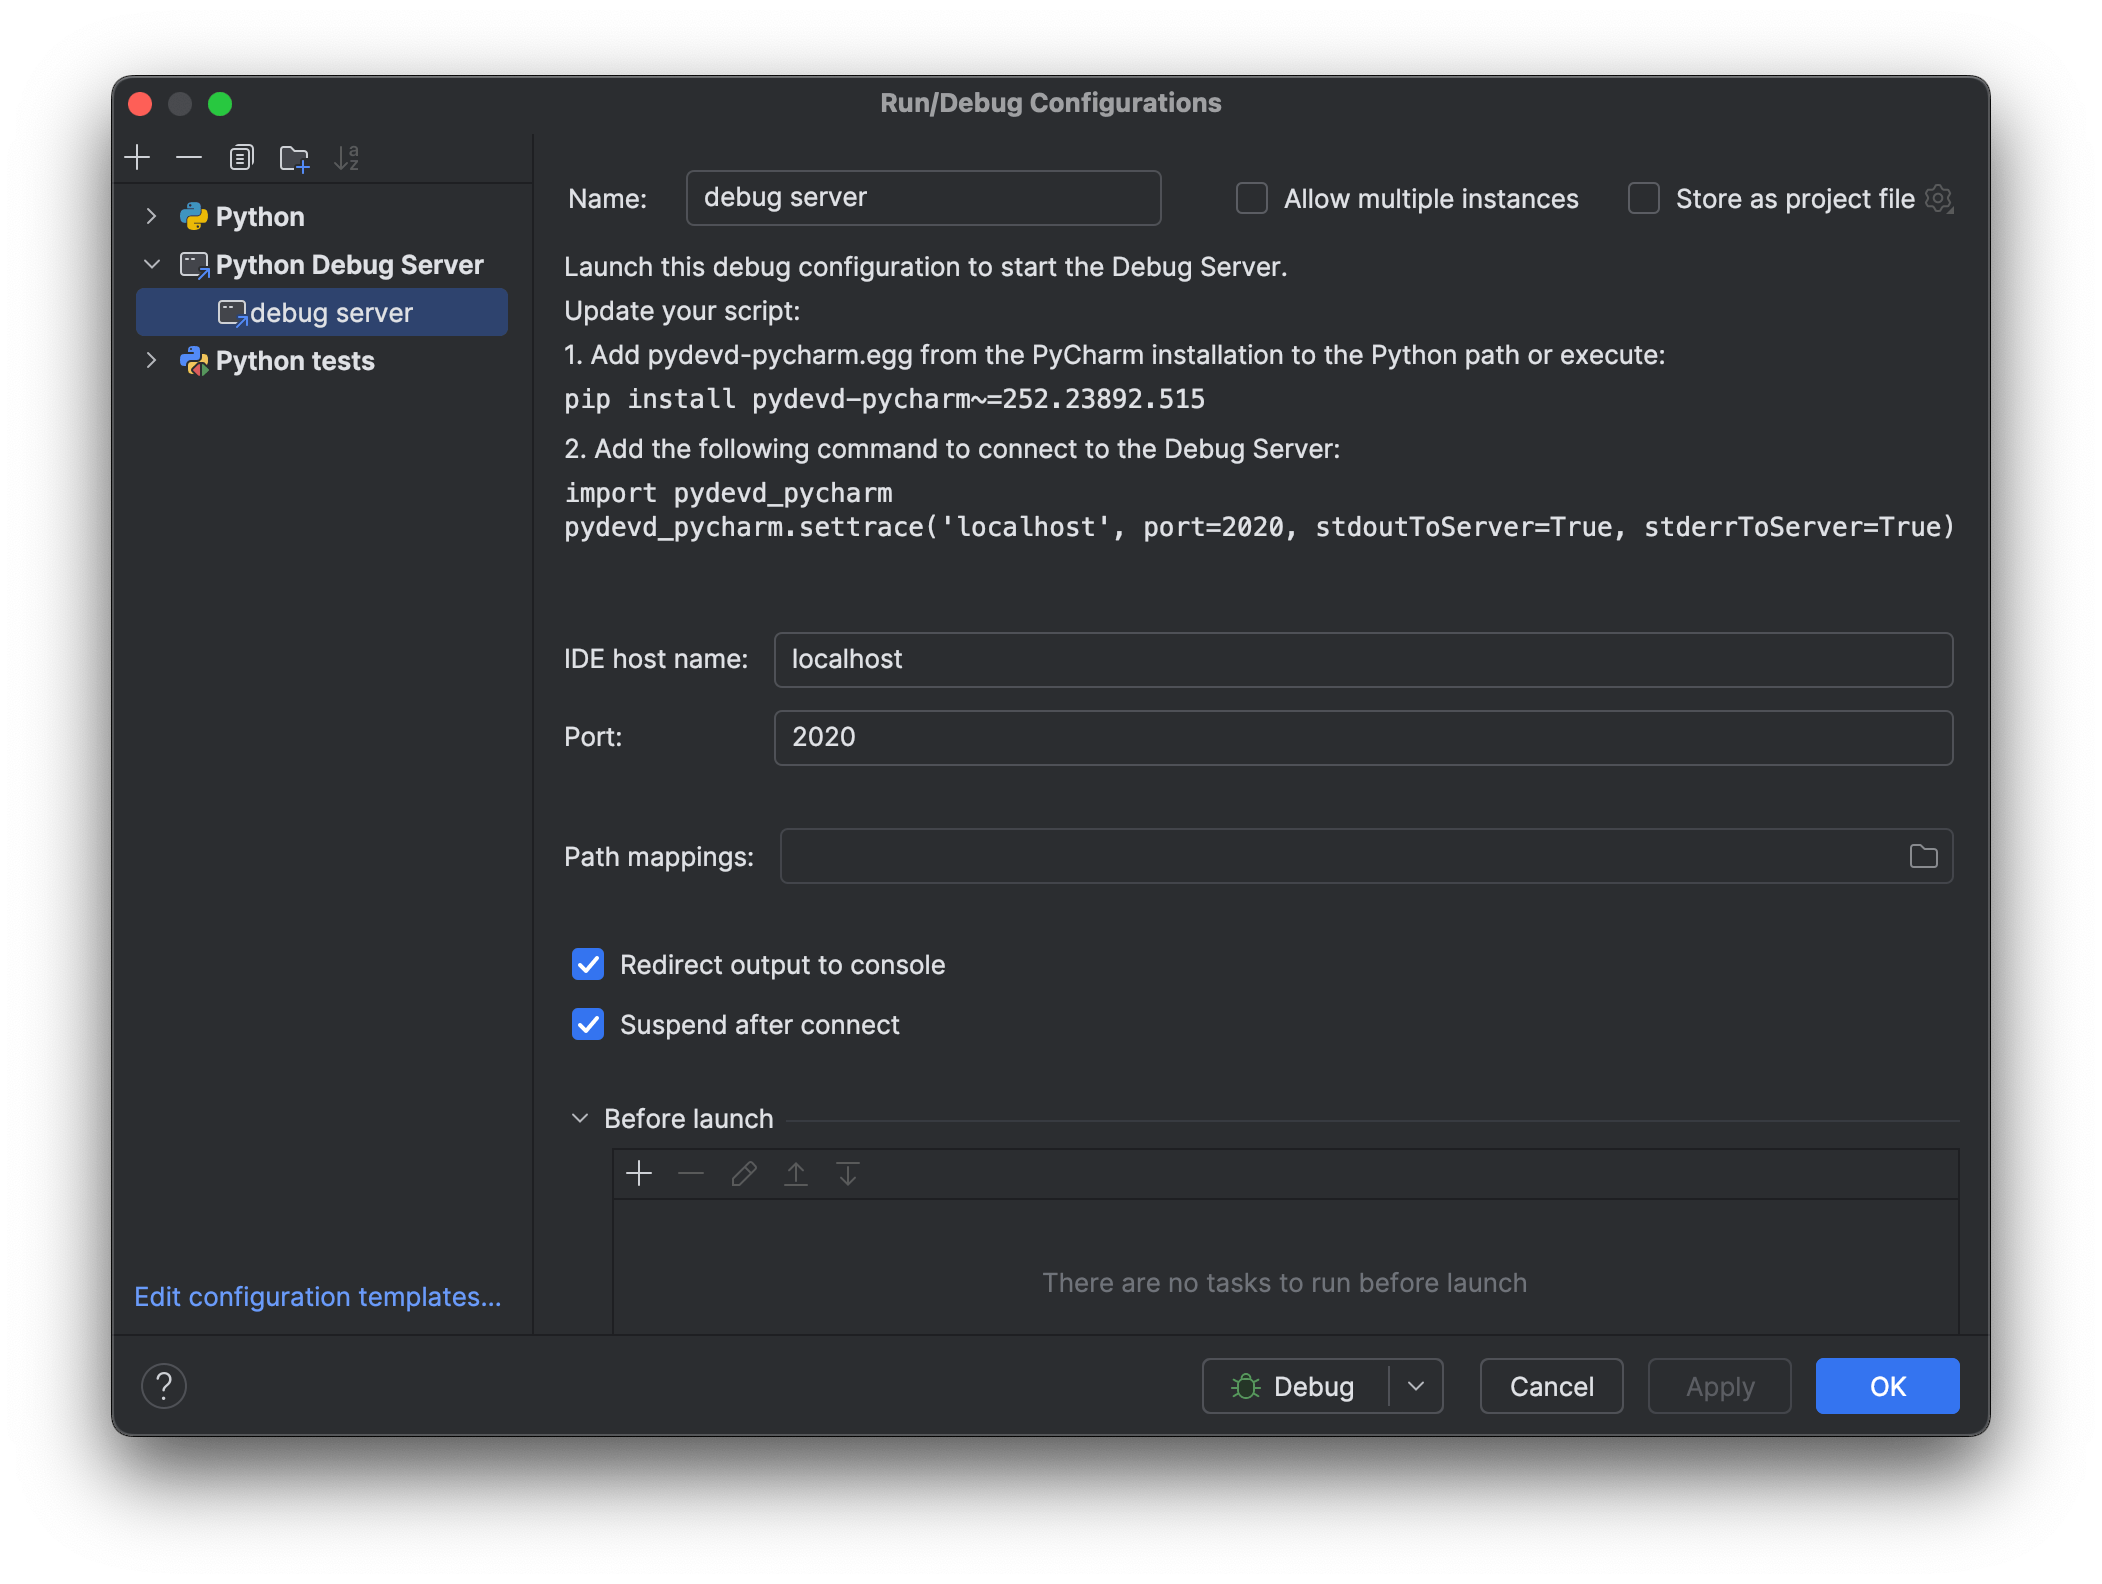
# Debug server
import logging
import sys

def connect_debug_server() -> None:
    logging.debug(f"Python path used by Blender: {sys.executable}")
    import pydevd_pycharm
    pydevd_pycharm.settrace('localhost', port=2020)
Then, start the configuration in PyCharm, and run the Blender script. The IDE will stop at the breakpoint.
VSCode
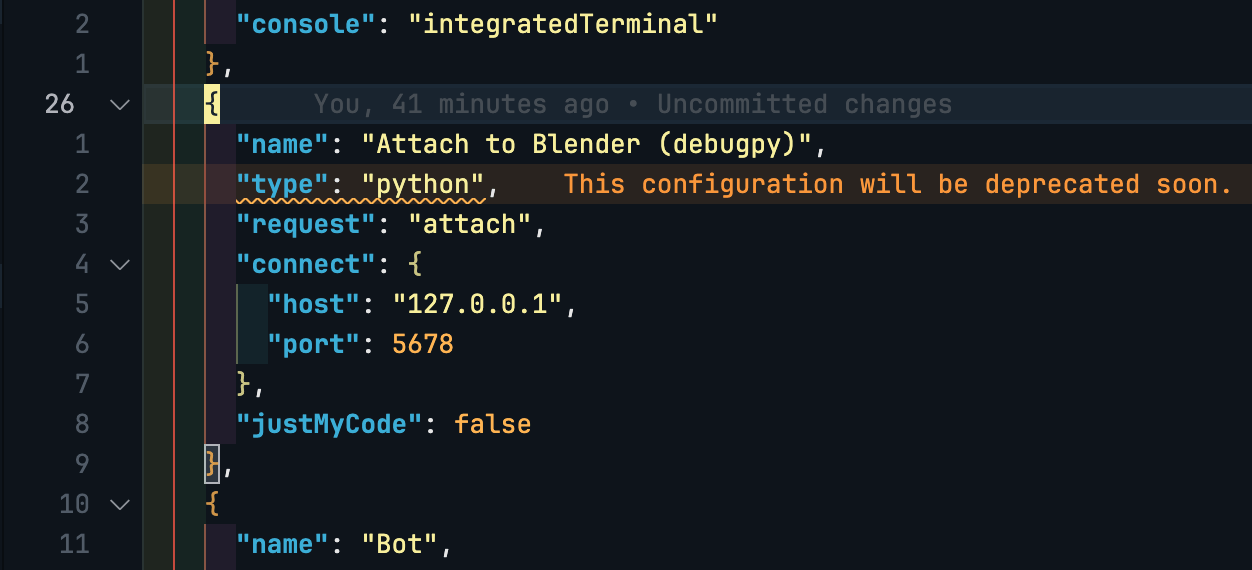
The method for VSCode is similar, except it uses the debugpy library. Below is a script for connecting to the debug server and the configuration you need to add to launch.json. The sequence of actions is as follows: first, run the Blender script—it will wait for a connection to the debug server. Then, start the configuration from launch.json, and the IDE will stop at the breakpoint.
  // Configuration for launch.json
    {
      "name": "Attach to Blender (debugpy)",
      "type": "python",
      "request": "attach",
      "connect": {
        "host": "127.0.0.1",
        "port": 5678
      },
      "justMyCode": false
    },
# Debug server
import logging
import sys
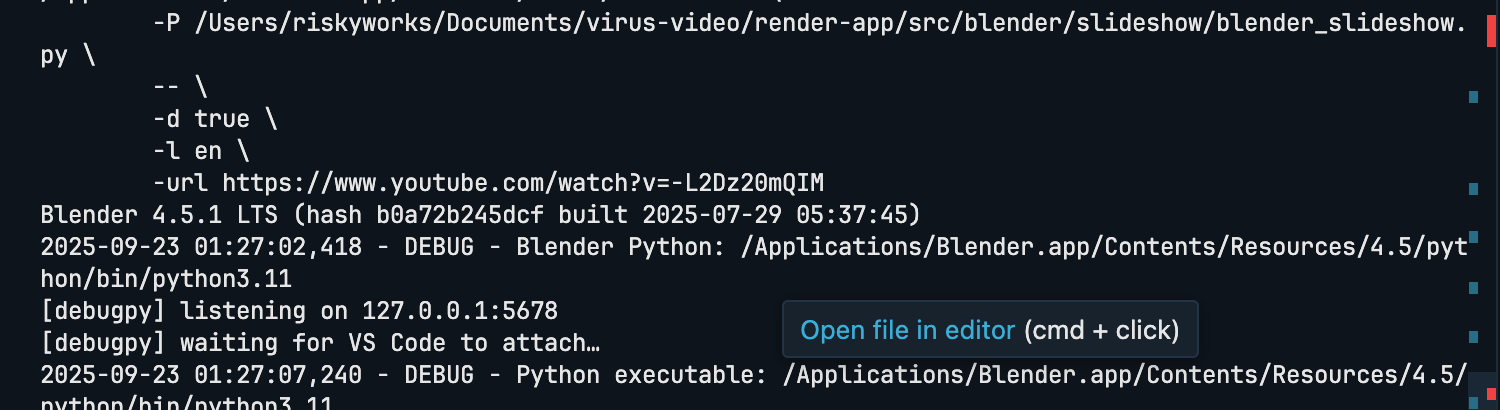
def connect_debug_server(host="127.0.0.1", port=5678, wait=False):
logging.debug(f"Blender Python: {sys.executable}")
try:
import debugpy
except Exception as e:
logging.error(f"debugpy not available: {e}")
return
try:
debugpy.listen((host, port)) # process listens on address:port
print(f"[debugpy] listening on {host}:{port}")
if wait:
print("[debugpy] waiting for VS Code to attach…")
debugpy.wait_for_client() # will stop here until attached
debugpy.breakpoint()
# optional: immediately catch the execution flow
except Exception as e:
logging.exception(f"debugpy.listen failed: {e}")
Open for contract collaboration
I am available for contract-based collaboration. If you have an interesting project idea, schedule a call via Calendly.
Schedule a 30-min call